Sub-pixel Fourier registration for wafer metrology
I implemented phase correlation with matrix-multiply DFT upsampling in NumPy: 1/100-pixel shifts that match scikit-image exactly on 50 of 50 tests, benchmarked across four wafer patterns and 15–40 dB of noise.
- Role
- Implementation, verification and benchmarking
- Setting
- Synthetic benchmark with exact Fourier-domain shifts · not yet validated on real wafer images
- Stack
- NumPy
- SciPy FFT
- Phase correlation
- scikit-image (cross-check)
Live demo · runs in your browser
Wafer pattern
- Truth
- (3.427, -5.184)
- Estimate
- …
- Error
- …
- Compute, your browser
- …
One shift is an anecdote. Run 50 random ones at the current pattern and noise.
- Real
- The registration runs live in your browser: a TypeScript port of the project's NumPy library, about 40 ms per 256×256 pair on a laptop.
- Checked
- Same estimate as the Python library on identical inputs for logic and DRAM patterns; within 0.09 px on patterns with spectral nulls, where FFT rounding decides (mean error within 1%).
- Differs from the notebook
- 256×256 instead of 512×512 and a browser random generator, so batch numbers will not match the notebook tables exactly. Nothing is uploaded.
Key results
- estimate grid
0.01 px
estimate grid
upsampling factor κ = 100
- identical to scikit-image
50 / 50
identical to scikit-image
random shifts
- per 512×512 pair
~24 ms
per 512×512 pair
median, CPU
01
Problem & constraints
Wafer inspection and overlay metrology compare images that differ by fractions of a pixel. A naive cross-correlation peak is quantised to whole pixels, and zero-padding the spectrum to refine it is expensive.
02
My contribution
Implementation, verification and benchmarking
- Implemented phase correlation and Guizar-Sicairos matrix-multiply DFT refinement with NumPy and SciPy only.
- Cross-checked against scikit-image's reference implementation.
- Generated four synthetic wafer topologies with a noise and optics model, using exact Fourier-domain shifts.
03
Method & key decisions
Integer peak, then a local DFT
The normalised cross-power spectrum keeps only phase; its inverse is a sharp peak at the shift. Instead of zero-padding by κ, the inverse DFT is evaluated only on a 1.5κ × 1.5κ grid around the coarse peak as two matrix products: O(κN²) instead of O(κ²N² log κN).
Test shifts without interpolation
Benchmark targets are shifted exactly in the frequency domain; bilinear or bicubic warping would blur the image and bias the result.
Porting it exposed a weak spot
The browser port gives the same estimate as the NumPy library on every logic and DRAM case, but differs by up to 0.09 px on reticle and power patterns. The cause: those clean patterns have exact spectral nulls, where the cross-power spectrum is about 1e-14 and its phase is FFT rounding noise. Phase normalisation amplifies those bins to full weight. Dropping them in a follow-up experiment cut the error on every pattern, most on power/MEMS (2.3×).
04
Evaluation
- Data
- Four synthetic wafer patterns, Gaussian optical PSF σ = 1.2 px, Gaussian sensor noise
- Protocol
- Mean Euclidean error over 50 random shifts in ±8 px, fixed seed
- Hardware
- CPU
| SNR (dB) | Power / MEMS | Overlay reticle | Logic | DRAM array |
|---|---|---|---|---|
| 15 | 0.1911 | 0.0774 | 0.0512 | 0.0333 |
| 20 | 0.132 | 0.0452 | 0.0375 | 0.0235 |
| 25 | 0.0784 | 0.0331 | 0.0246 | 0.016 |
| 30 | 0.0578 | 0.0225 | 0.0172 | 0.0121 |
| 35 | 0.0404 | 0.0178 | 0.0129 | 0.0087 |
| 40 | 0.0256 | 0.0148 | 0.0099 | 0.0069 |
Fine periodic patterns carry strong high-frequency phase and register best; wide power/MEMS fingers are 3–6× less precise at the same noise.
| Pattern | Library | Null bins dropped | Improvement |
|---|---|---|---|
| Logic | 0.0430 | 0.0325 | 1.3× |
| DRAM array | 0.0385 | 0.0255 | 1.5× |
| Overlay reticle | 0.0776 | 0.0495 | 1.6× |
| Power / MEMS | 0.1665 | 0.0723 | 2.3× |
05
Results




06
Failures, limits & next steps
Limitations
- Best-case benchmark: pure circular translation, the model the method assumes.
- The 0.01 px grid is a floor at κ = 100.
Next steps · what would prove it
- Fold null-bin masking or magnitude weighting into the library and re-run the benchmark.
- Hann apodisation before the FFT; a log-polar stage for rotation and scale.
- Validation on real optical overlay images; a batched CUDA port.
07
Code & references
- M. Guizar-Sicairos, S. T. Thurman, J. R. Fienup. Efficient subpixel image registration algorithms. Optics Letters 33(2), 2008.
Related projects
Next: Surgical tool detectionComputer Vision · Deep Learning
Industrial defect segmentation with a C++ TensorRT app
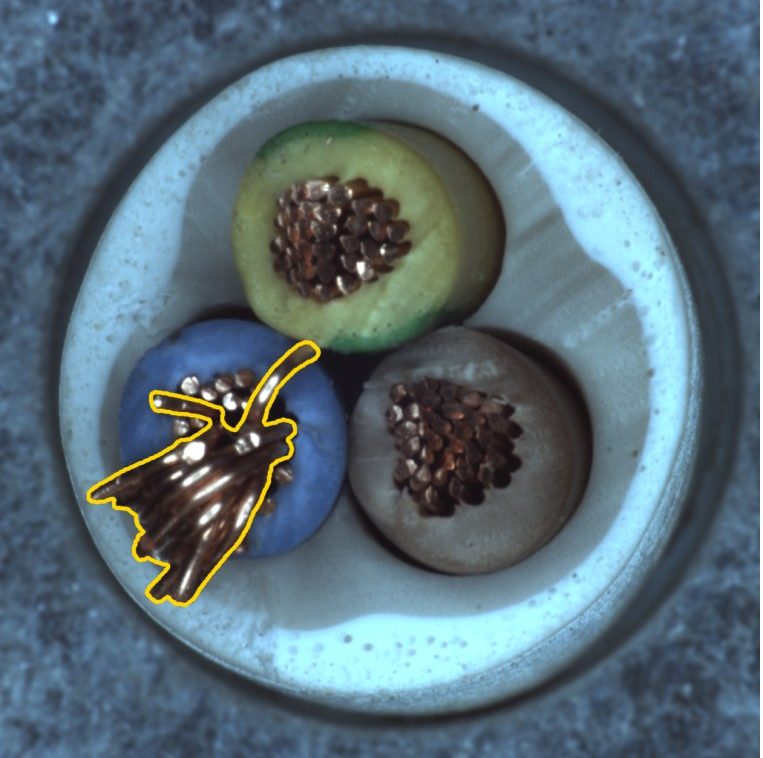
I trained YOLO11-seg on MVTec AD to 0.82 mask mAP50, wrote the C++ TensorRT app that serves it, and found that rebalancing VisA's data lifted mask mAP50 from 0.25 to 0.41 where a bigger model did nothing.
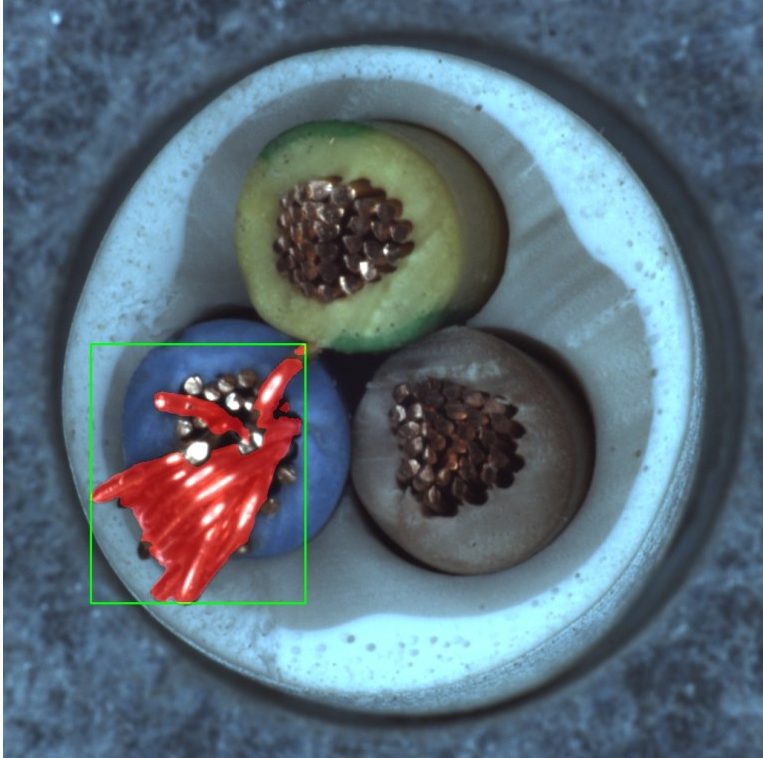 Ground truthC++ output
11 / 15held-out defects located by the C++ app
Robotics · Signal Processing
Physics-grounded fault detection & diagnosis for a cobot
I built an interpretable pipeline on real cobot telemetry: an unsupervised detector flags faulty cycles at AUROC 0.944 with a 1.7% false-alarm rate, and a Random Forest names the fault.
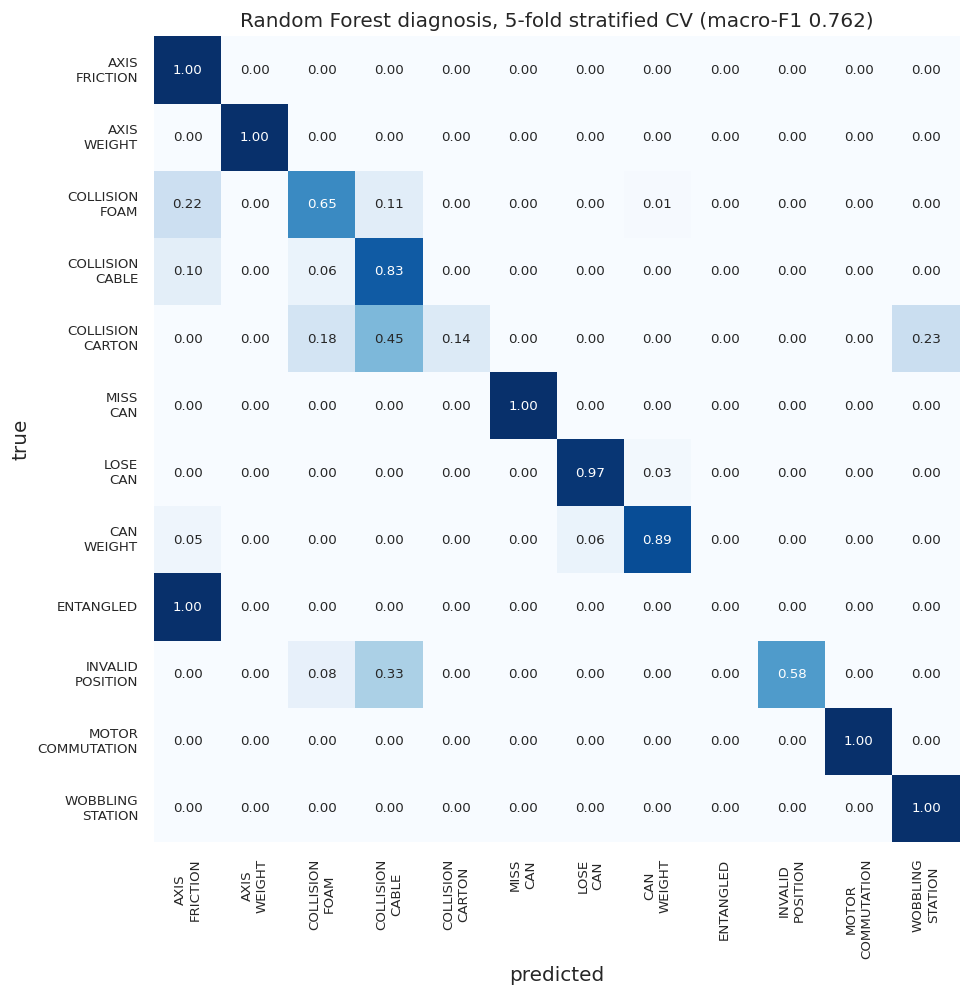
0.944AUROC, faulty vs normal cycles
Computer Vision · Edge Deployment
Infrared small-target detection & tracking
I built a detector and tracker for 3–7 pixel aerial targets in infrared video, then ported it from Python to C++/CUDA/TensorRT: 1.7 ms per frame, 9.3× faster, with tracks identical to the prototype.
1.7 msper 1280×1024 frame, enhance → detect → track
Contact
Want to go deeper on this project? I'm happy to walk through it.
Open to full-time engineering roles. If the problem is hard and the data is messy, I'm interested.