Physics-grounded fault detection & diagnosis for a cobot
I built an interpretable pipeline on real cobot telemetry: an unsupervised detector flags faulty cycles at AUROC 0.944 with a 1.7% false-alarm rate, and a Random Forest names the fault.
- Role
- Design, implementation and evaluation
- Setting
- Offline evaluation on recorded telemetry from a physical robot (voraus-AD); not deployed on a controller
- Stack
- pandas
- scikit-learn
- PCA
- Random Forest
- NumPy
Key results
- detection AUROC
0.944
detection AUROC
419 normal + 755 faulty test cycles
- false-alarm rate
1.7%
false-alarm rate
limit set from training data only (1% design target)
- mean per-category AUROC
0.959
mean per-category AUROC
paper's MVT-Flow baseline reports 0.936
- diagnosis macro-F1
0.762
diagnosis macro-F1
12 faults, chance 0.083 balanced acc.
01
Problem & constraints
A collaborative robot runs the same pick-and-place cycle over and over, and some cycles go wrong: a collision, a lost can, extra joint friction, a motor commutation fault.
Labelled faults are rare in practice, so detection has to be learned from normal cycles alone; and an operator needs to know which fault happened, not just that something did.
Can physically meaningful residuals flag faulty cycles from normal data alone, at a false-alarm rate an operator would tolerate?
Constraints
- Alarm limits must be set without touching test data.
- No session confounders: each fault variant was recorded in its own session.
- CPU-only and interpretable: pandas and scikit-learn.
02
My contribution
Design, implementation and evaluation
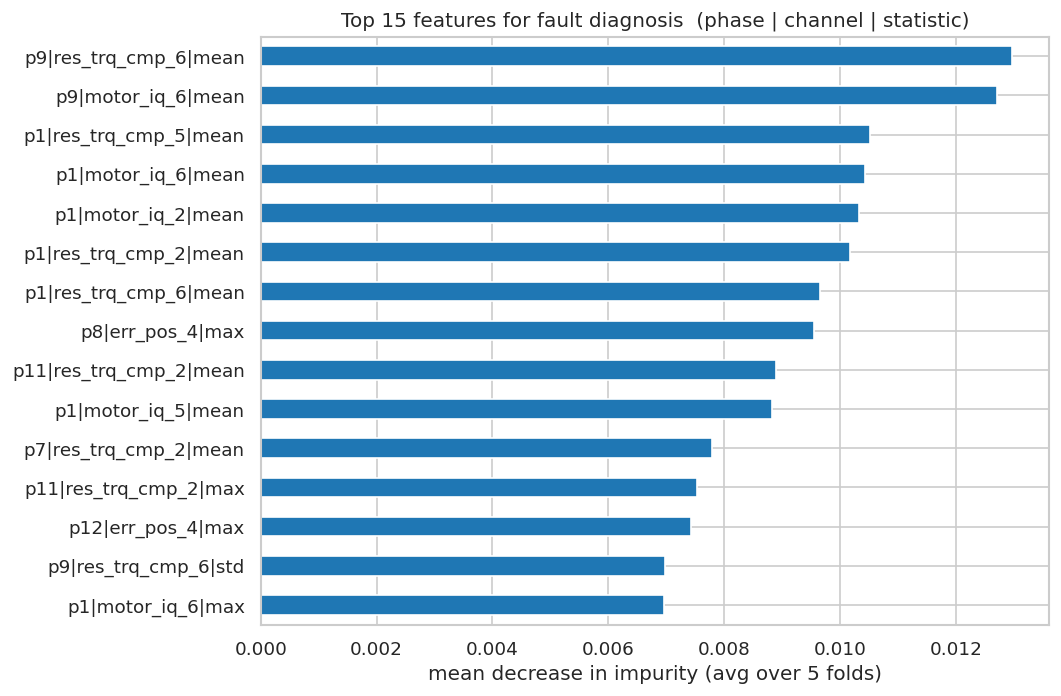
- Engineered physics residuals (tracking errors, measured − model torque) summarised per program phase: 27 channels × 14 phases × 3 statistics.
- Built the PCA/SPE detector and found that in-sample alarm limits are badly optimistic; replaced them with cross-validated limits.
- Excluded supply voltage as a session confounder by design.
- Trained the fault classifier and measured how it generalises to unseen fault variants.
03
System architecture
01 · Telemetry · 100 Hz
data
Joint position, velocity, torque, current
6 axes + robot currents
data
Program phase ID
02 · Physics residuals
process
target − measured
position, velocity
process
measured − model torque
03 · Per-phase features
process
1,134 features
27 ch × 14 phases × {mean, std, max}
04 · Detect
model
PCA (332 comp.) → SPE
fit on normals only
05 · Diagnose
model
Random Forest
12 fault types
output
Alarm + fault label
04
Method & key decisions
Residuals a healthy servo keeps small
For each axis: target − measured position and velocity, and measured − model-computed motor torque, plus motor current. Faults happen at specific moments (grasp, transport, place), so statistics are computed per program phase.
Detector trained on normal cycles only
Normal cycles lie near a low-dimensional subspace. PCA keeps 95% of normal variance (332 components); the squared prediction error (SPE) measures what normal behaviour cannot explain.
Cross-validated alarm limits
With 332 components fitted to 948 cycles, PCA reconstructs its own training cycles almost perfectly. The in-sample 99th-percentile limit (43.8) would flag 100% of test normals. Scoring each training cycle with a PCA fitted on the other 4/5 gives a limit of 185.5 and a 1.7% false-alarm rate.
Supply voltage excluded for a physical reason
Voltage reflects the plant's supply, which differs per recording session. A model using it could learn the session instead of the fault, so it is not even loaded.
05
Evaluation
- Dataset
- voraus-AD, 100 Hz telemetry from a physical cobot
- Training
- 948 normal cycles (one recording session)
- Test
- 419 normal + 755 faulty cycles, 12 fault types
- Diagnosis
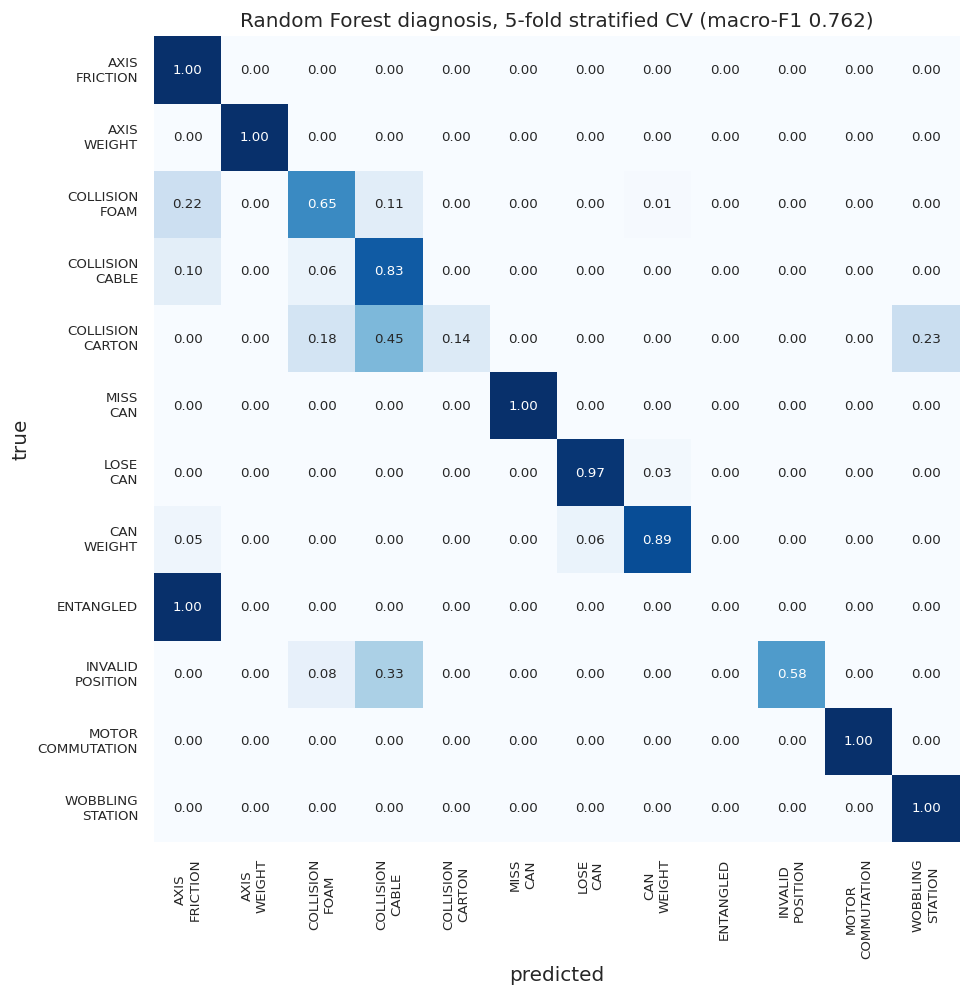
- 5-fold out-of-fold predictions on the 755 faulty cycles; plus variant-held-out folds
- Hardware
- CPU (pandas, scikit-learn)
| Invalid position | 100% |
|---|---|
| Missed can | 100% |
| Motor commutation | 97.8% |
| Collision: carton | 86.4% |
| Wobbling station | 81.1% |
| Lost can | 66.2% |
| Collision: cable | 54.2% |
| Can weight | 52.5% |
| Axis weight | 42.3% |
| Collision: foam | 38.9% |
| Axis friction | 38.2% |
| Entangled | 20% |
| Normal cycles (false alarms) | 1.7% |
Faults that change the cycle's dynamics strongly are easy; small extra friction or load is subtle.
| Cross-validation | Macro-F1 | Balanced accuracy |
|---|---|---|
| Stratified 5-fold (fault variants seen in training) | 0.762 | 0.756 |
| Variant held out (all 12 faults) | 0.417 | 0.444 |
| Variant held out, 9 multi-variant faults | 0.556 | — |
06
Try it
Loading 13 recorded cycles…
- Real
- Joint angles, residuals and detector/classifier outputs for 13 recorded voraus-AD test cycles (one normal, one per fault: the median-scoring cycle of each category).
- Schematic
- The arm drawing uses generic link lengths and axes 1–4 only. It shows the recorded motion, not the robot's real geometry.
- Runs where
- Pre-computed by the project notebook; your browser only replays and plots it. No model runs here, and nothing is uploaded.
07
Results
08
Failures, limits & next steps
Detection quality depends on the fault
Entangled cycles are flagged only 20% of the time and axis friction 38%. Their effect on the cycle is small, and the per-phase summary statistics dilute it.
Collisions get confused with one another
Foam, cable and carton collisions share a signature, and Entangled is always read as Axis friction in the confusion matrix.
Generalising to a new variant is hard
Holding whole fault variants out drops macro-F1 from 0.762 to 0.417: the classifier recognises known variants far better than new ones.
Limitations
- One dataset, one robot, one task.
- Uses the program-phase signal, which a deployment would need from the controller.
- Test normals were recorded after training; false alarms cluster at the end of that recording, suggesting session drift.
- MVT-Flow comparison is indicative only: this pipeline uses phase alignment, and the paper's figure is a 9-run mean of a deep model.
Next steps · what would prove it
- Online re-calibration against session drift, evaluated on timestamped streams.
- Event-level features (peak timing) for subtle faults such as Entangled.
- Run the detector on a live controller stream to measure latency and alarm stability.
09
Code & references
- J. T. Brockmann, M. Rudolph, B. Rosenhahn, B. Wandt. The voraus-AD Dataset for Anomaly Detection in Robot Applications. IEEE T-RO, 2023. arXiv:2311.04765.
Datavoraus-AD is CC BY-NC-SA 4.0; telemetry excerpts in the Lab are shown with attribution for non-commercial illustration.
Related projects
Next: Camera–LiDAR fusionComputer Vision · Deep Learning
Industrial defect segmentation with a C++ TensorRT app
I trained YOLO11-seg on MVTec AD to 0.82 mask mAP50, wrote the C++ TensorRT app that serves it, and found that rebalancing VisA's data lifted mask mAP50 from 0.25 to 0.41 where a bigger model did nothing.
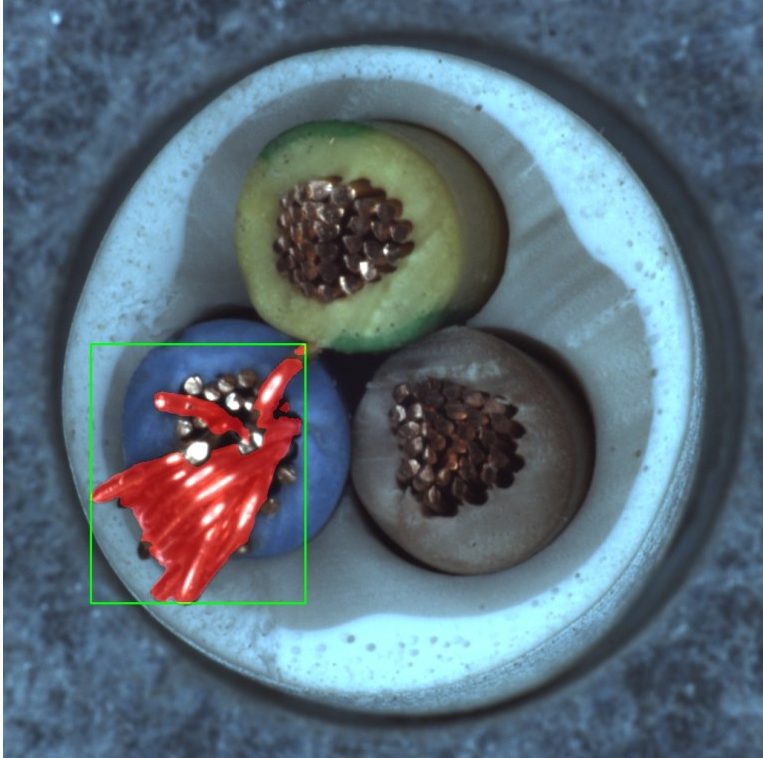 Ground truthC++ output
11 / 15held-out defects located by the C++ app
Computer Vision · Edge Deployment
Infrared small-target detection & tracking
I built a detector and tracker for 3–7 pixel aerial targets in infrared video, then ported it from Python to C++/CUDA/TensorRT: 1.7 ms per frame, 9.3× faster, with tracks identical to the prototype.
1.7 msper 1280×1024 frame, enhance → detect → track
Signal Processing · Computer Vision
Sub-pixel Fourier registration for wafer metrology
I implemented phase correlation with matrix-multiply DFT upsampling in NumPy: 1/100-pixel shifts that match scikit-image exactly on 50 of 50 tests, benchmarked across four wafer patterns and 15–40 dB of noise.
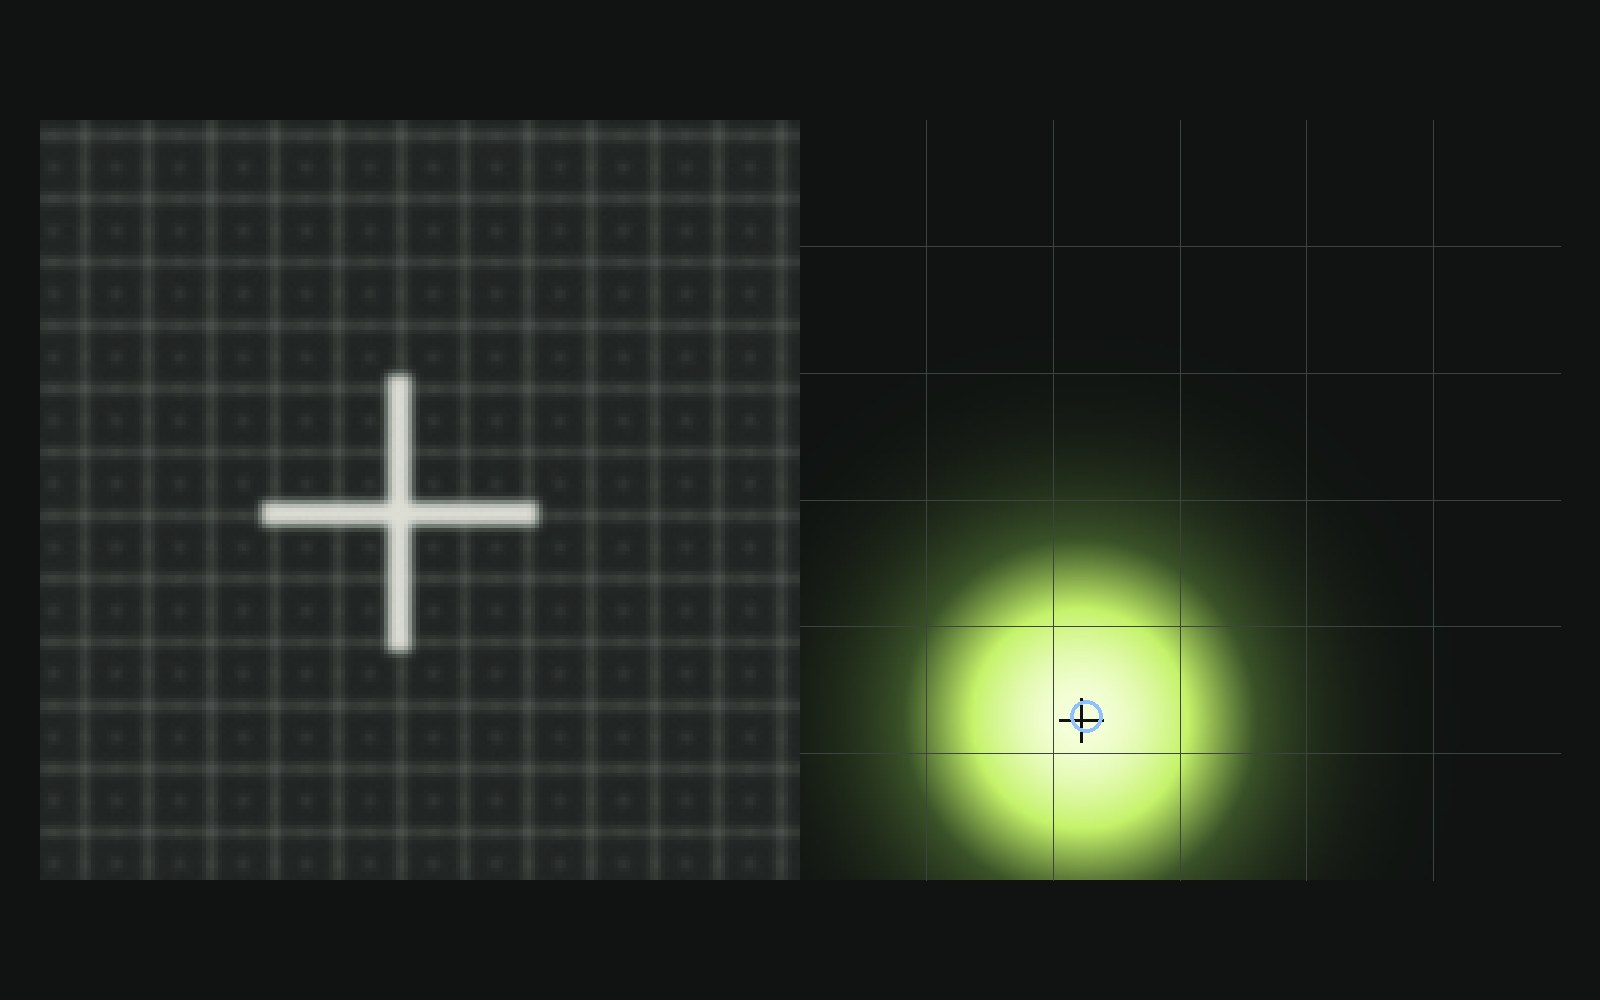
0.015 pxmean error on a DRAM array
Contact
Want to go deeper on this project? I'm happy to walk through it.
Open to full-time engineering roles. If the problem is hard and the data is messy, I'm interested.